Outline
- Background of this series
- Book and AutomateTutorial
- Basic and Enviroment
- Main content
- Open and Read a '.xlsx' file
- Edit a '.xlsx' file
- Beautify a '.xlsx' file
- Else

AutomateTutorial
- Work with Excel files in Python
- Work with CSV files & JSON in Python
- Task Schedule
- Sending Email
- Control Mouse & Keyboard
Basic and Enviroment

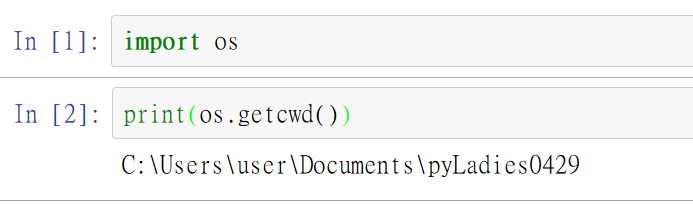
Move the .xlsx file to the folder of Jupyter notebook
Where is my Jupyter notebook folder? Use 'os.getcwd()' to check!
Let's Start!
What Will We Do on the '.xlsx' File
- Open it
- Edit it
- Beautify it
- Else
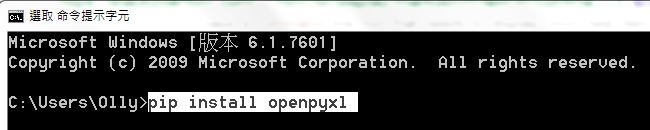
Open Excel with Openpyxl
In [1]:
import openpyxl
wb = openpyxl.load_workbook('D1_01.xlsx')
wb
Out[1]:
How to Get Sheet
List ALL sheets I can get
In [2]:
wb.get_sheet_names()
Out[2]:
In [3]:
sh2 = wb.get_sheet_by_name('Sheet2')
sh2
Out[3]:
The Title of Sheet
In [4]:
sh2.title
Out[4]:
Get The Active Sheet
In [5]:
activeSheet = wb.active
activeSheet
Out[5]:
How to Get Value in Sheet
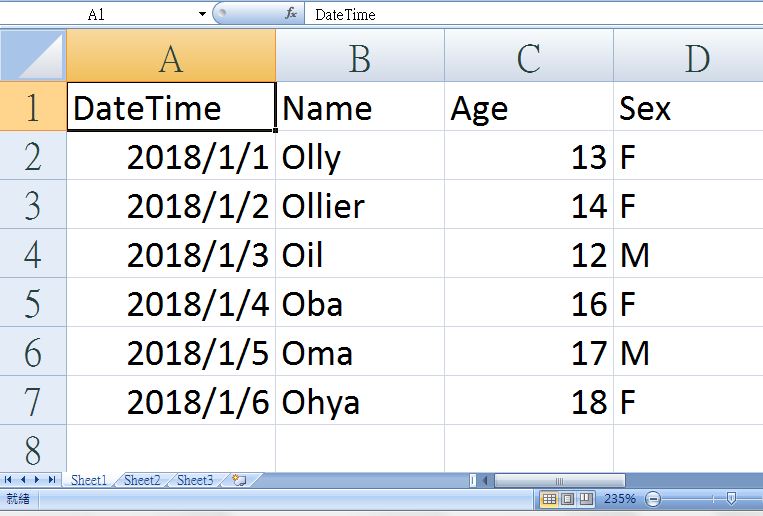
In [6]:
sh1 = wb.get_sheet_by_name('Sheet1')
sh1['A1'].value
Out[6]:
In [8]:
sh1.cell(row=2,column=2).value
Out[8]:
In [7]:
sh1['A2'].value
# 貼心的 '.value' 把資料型別也讀到了 :D
Out[7]:
In [9]:
for i in range(1,5):
    print(i, sh1.cell(row=i, column=2).value)
row和column都是用excel的視角看,所以從1開始數,別跟list的index概念搞混了。
Get Max Row & Max Column
In [10]:
sh1.max_row
Out[10]:
In [11]:
sh1.max_column
Out[11]:
注意:此方法有可能回傳比實際上多的結果,原因目前尚未研究出。
Get Column Letter & Get Index
In [12]:
from openpyxl.utils import get_column_letter,column_index_from_string
In [13]:
get_column_letter(1)
Out[13]:
In [14]:
get_column_letter(27)
Out[14]:
In [15]:
column_index_from_string('B')
Out[15]:
In [16]:
column_index_from_string('AB')
Out[16]:
Get a Cell Zone
In [17]:
sh1['A2':'D3']
Out[17]:
In [18]:
for row in sh1['A2':'D3']:
    print(row)
In [19]:
for row in sh1['A2':'D3']:
    for cell in row:
        print(cell)
In [20]:
for row in sh1['A2':'D3']:
    for cell in row:
        print(cell.coordinate, '=', cell.value)
    print('★~~~~~~~ End of row ~~~~~~~★')
Get Specific Row & Column
In [23]:
sh1[2] # 數字若是字串格式也可以唷!
Out[23]:
In [24]:
for cell in sh1[2]:
    print(cell.value)
In [25]:
sh1['B']
Out[25]:
In [26]:
for cell in sh1['B']:
    print(cell.value)
Practice time ♫
- Open Excel with Openpyxl
- load_workbook('YourFlie.xlsx')
- Get a Sheet
- get_sheet_by_name('SheetName')
- Get the Value of Cells
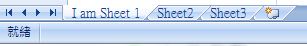
Modify Sheet Name
In [27]:
sh1.title = 'I am Sheet 1'
sh1.title
Out[27]:
In [28]:
wb.save('D1_02.xlsx')
Create & Delete Sheet
In [29]:
import openpyxl
wb = openpyxl.Workbook()  # 開一個新的'.xlsx'檔案
wb.get_sheet_names()
Out[29]:
In [30]:
wb.create_sheet()
wb.get_sheet_names()
Out[30]:
In [31]:
wb.create_sheet(index=0, title='Fist Sheet')
wb.get_sheet_names()
Out[31]:
In [32]:
wb.create_sheet(index=2, title='Middle Sheet')
wb.get_sheet_names()
Out[32]:
In [33]:
wb.remove_sheet(wb.get_sheet_by_name('Sheet'))
wb.get_sheet_names()
Out[33]:
In [34]:
wb.save('D1_03.xlsx')
![]()
Fill Value into Cell
In [35]:
wb = openpyxl.Workbook()
sh = wb.active
In [36]:
sh['A1'] = 'My First Value'
sh['A1'].value
Out[36]:
In [37]:
wb.save('D1_04.xlsx')
![]()
Practice time ♫
- Create a '.xlsx' File
- Workbook()
- Create Sheets
- create_sheet()
- Fill Values into Cells
- Save the File
- save('FileName.xlsx')
Set Font
In [38]:
from openpyxl.styles import Font
wb = openpyxl.Workbook()
sh = wb.active
In [39]:
FontStyle = Font(name='Calibri', size=50, italic=True, bold=True)
sh['A1'].font = FontStyle
sh['A1'] = 'Hello Font'
In [40]:
wb.save('D1_05.xlsx')
![]()
Set Algorithms
In [41]:
wb = openpyxl.Workbook()
sh = wb.active
In [42]:
sh['A1'] = 10
sh['A2'] = 20
sh['A3'] = 30
sh['A4'] = '=SUM(A1:A3)'
In [43]:
wb.save('D1_06.xlsx')
![]()
Set Height & Width for Row & Column
In [44]:
wb = openpyxl.Workbook()
sh = wb.active
In [45]:
sh['A1'] = 'Tall Row'
sh['B2'] = 'Wide Column'
In [46]:
sh.row_dimensions[1].height = 50
sh.column_dimensions['B'].width = 30
In [47]:
wb.save('D1_07.xlsx')
![]()
Merge cells
In [48]:
wb = openpyxl.Workbook()
sh = wb.active
In [49]:
sh.merge_cells('A1:C3')
sh['A1'] = '9 Cells Merged Together!'  # 注意:合併儲存格後,只會留下起始儲存格座標
sh.merge_cells('C5:D5')
sh['C5'] = 'Two Merged Cells~'
In [50]:
wb.save('D1_08.xlsx')
![]()
Unmerge Cells
In [51]:
wb = openpyxl.load_workbook('D1_08.xlsx')
sh = wb.active
In [52]:
sh.unmerge_cells('A1:C3')
sh.unmerge_cells('C5:D5')
In [53]:
wb.save('D1_08.xlsx')
![]()
Freeze Cells
| Freeze_panes | Freeze Rows & Columns |
|---|---|
| freeze_panes = 'A2' | Row 1 |
| freeze_panes = 'B1' | Column A |
| freeze_panes = 'C1' | Column A & B |
| freeze_panes = 'C2' | Row1 & Column A & Column B |
| freeze_panes = 'A1' | Non Freeze |
| freeze_panes = None | Non Freeze |
In [54]:
wb = openpyxl.load_workbook('D1_01.xlsx')
sh = wb.active
In [55]:
sh.freeze_panes = 'A2'
In [56]:
wb.save('D1_09.xlsx')
![]()
Practice time ♫
- Set Font
- import Font
- Set Algorithms
- Set Height & Width for Row & Column
- row_dimensions[ ] & height
- column_dimensions[ ] & width
- Merge and Unmerge cells
- merge_cells()
- unmerge_cells()
- Freeze Cells
- freeze_panes
延伸挑戰 - 圖表
Plot
| Chart Type | Function |
|---|---|
| Bar Chart | openpyxl.chart.BarChart() |
| Line Chart | openpyxl.chart.LineChart() |
| Scatter Chart | openpyxl.chart.ScatterChart() |
| Pie Chart | openpyxl.chart.PieChart() |
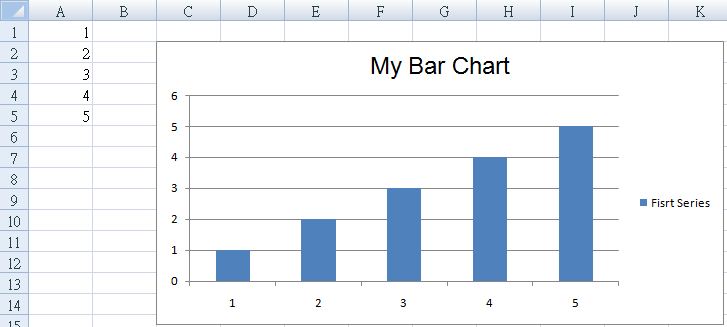
In [57]:
wb = openpyxl.Workbook()
sh = wb.active
In [58]:
for i in range(1, 6):
    sh['A' + str(i)] = i
In [59]:
# 界定一組資料範圍
ref = openpyxl.chart.Reference(sh,
                               min_col = 1,
                               min_row = 1,
                               max_col = 1,
                               max_row = 5)
# 為資料組設定名稱
ser = openpyxl.chart.Series(ref, title='Fisrt Series')
In [60]:
barChart = openpyxl.chart.BarChart()
barChart.title = 'My Bar Chart'
barChart.append(ser)
In [61]:
sh.add_chart(barChart, 'C2') # 圖表種類,圖表繪製起點
In [62]:
wb.save('D1_10.xlsx')
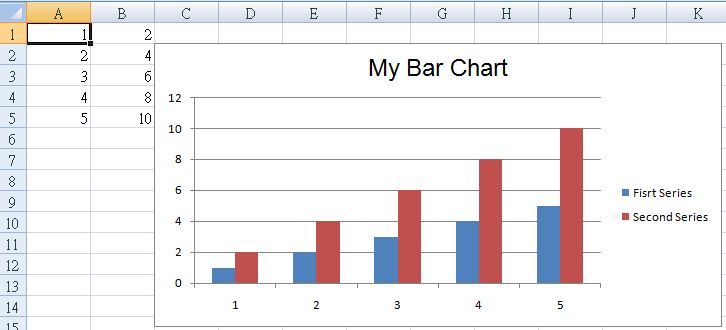
Example 1
In [63]:
import openpyxl
from openpyxl.chart import BarChart, Reference, Series

wb = openpyxl.Workbook()
sh = wb.active

for i in range(1, 6):
    sh['A' + str(i)] = i
    sh['B' + str(i)] = i*2

ref1 = Reference(sh, min_col = 1, max_col = 1, min_row = 1, max_row = 5)
ser1 = Series(ref1, title='Fisrt Series')
ref2 = Reference(sh, min_col = 2, max_col = 2, min_row = 1, max_row = 5)
ser2 = Series(ref2, title='Second Series')

barChart = BarChart()
barChart.title = 'My Bar Chart'
barChart.append(ser1)
barChart.append(ser2)

sh.add_chart(barChart, 'C2')
In [64]:
wb.save('D1_11.xlsx')
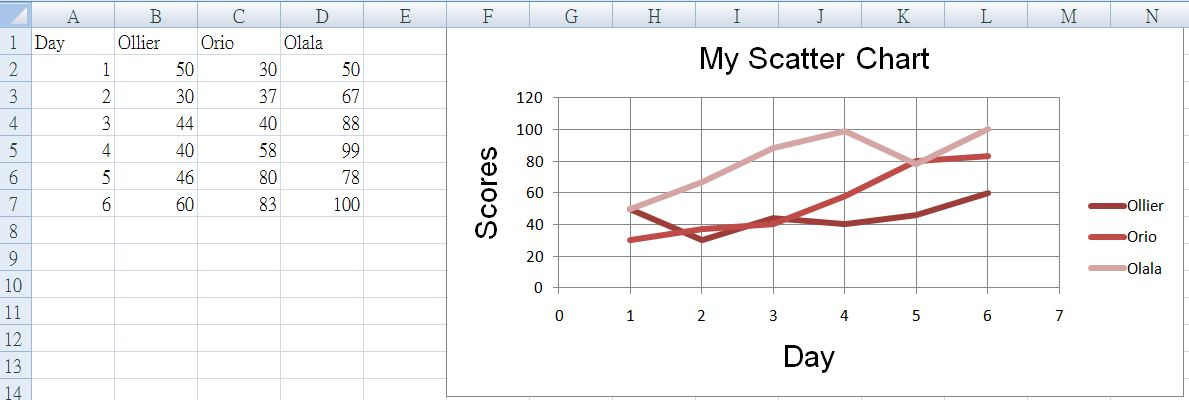
Example 2
In [65]:
import openpyxl
from openpyxl.chart import ScatterChart, Reference, Series

wb = openpyxl.Workbook()
sh = wb.active

rows = [['Day', 'Ollier', 'Orio', 'Olala'],
        [1, 50, 30, 50],
        [2, 30, 37, 67],
        [3, 44, 40, 88],
        [4, 40, 58, 99],
        [5, 46, 80, 78],
        [6, 60, 83, 100],]

for row in rows:
    sh.append(row)

chart = ScatterChart()
chart.title = "My Scatter Chart"
chart.style = 12
chart.x_axis.title = 'Day'
chart.y_axis.title = 'Scores'

xvalues = Reference(sh, min_col=1, max_col=1, min_row=2, max_row=7)
for i in range(2, 5):
    values = Reference(sh, min_col=i, max_col=i, min_row=1, max_row=7)
    series = Series(values, xvalues, title_from_data=True)
    chart.series.append(series)

sh.add_chart(chart, "F1")
In [66]:
wb.save('D1_12.xlsx')